Mortgage Calculator
Enter Loan Details
Results
Monthly Payment: $0
| Type | Monthly | Total |
|---|---|---|
| Principal & Interest | $0 | $0 |
| Property Tax | $0 | $0 |
| Home Insurance | $0 | $0 |
| Other Costs | $0 | $0 |
| Total Out-of-Pocket | $0 | $0 |
Mortgage Calculator – Estimate Your Monthly Home Loan Payment
Buying a home is the largest financial commitment most households ever take on, and understanding the true size of that monthly obligation matters more than almost any other number in your budget. A mortgage calculator turns the mechanics of a home loan — principal, interest, taxes, and insurance — into a single, concrete monthly figure you can actually plan around. Because mortgage rates move week to week with the broader economy, being able to model your own numbers, rather than relying on a rate you saw once, is what makes a calculator like this useful for more than a single afternoon.
What is a Mortgage Calculator?
A mortgage calculator is a financial modeling tool that combines your loan amount, interest rate, repayment term, and ownership costs into a single monthly payment estimate. For most buyers, the structure of a mortgage is genuinely confusing — between amortization, escrow, and PMI, it's easy to underestimate what a home will actually cost each month. A calculator that includes taxes and insurance, not just principal and interest, gives you a realistic picture instead of an optimistic one.
This calculator specifically breaks your payment down into the metrics that matter most:
| Metric | Description | Why It Matters |
|---|---|---|
| Monthly Principal | The portion of the payment that reduces your loan balance. | Tracks how quickly you build home equity. |
| Monthly Interest | The cost paid to the lender for borrowing the money. | Shows the real cost of your interest rate over time. |
| Property Taxes | Local government levies based on your home's assessed value. | Varies enormously by state and county — see the chart below. |
| Insurance Premiums | Homeowners insurance (and PMI if your down payment is under 20%). | A required cost most buyers underestimate. |
| Total Loan Cost | The sum of every payment over the full loan term. | Reveals the real price of the home after decades of interest. |
Monthly PITI Breakdown: A Worked Example
For a $400,000 home with 20% down, a 6.5% rate, 1.2% property tax, $1,500/year insurance, and $4,000/year in other costs, the total monthly payment breaks down like this:
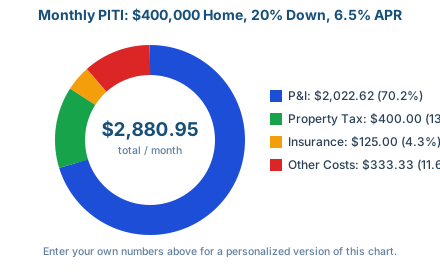
Principal and interest is the largest slice at 70.2% — but taxes, insurance, and other costs still add up to nearly 30% of the total. That's the gap a P&I-only calculator misses.
Mortgage Payment Formula
The precision of a mortgage calculator comes from the standard amortization formula. It ensures that while the ratio of principal to interest shifts every month, the total payment stays constant for the life of a fixed-rate loan.
The Mathematical Framework
The monthly mortgage payment (M) is calculated using:
- M (Monthly Mortgage Payment): Base principal and interest (P&I) payment.
- P (Principal Loan Amount): Total sum borrowed (purchase price minus down payment).
- r (Monthly Interest Rate): Annual rate divided by 12 (r = AnnualRate / 12).
- n (Total Number of Payments): Loan term in months (30 years = 360, 15 years = 180).
Example Calculation
Consider a home priced at $400,000 with a 20% down payment, requiring a loan of $320,000. At a 6.5% interest rate, the calculation proceeds as follows:
| Variable | Scenario Input | Calculated Value |
|---|---|---|
| Home Price | $400,000 | - |
| Down Payment | 20% | $80,000 |
| Principal (P) | $400,000 - $80,000 | $320,000 |
| Annual Rate | 6.5% | 0.065 |
| Monthly Rate (r) | 0.065 / 12 | 0.00541667 |
| Loan Term | 30 Years | - |
| Total Months (n) | 30 × 12 | 360 |
This $2,022.62 represents only principal and interest. A common mistake is forgetting the escrow components (taxes, insurance), which can add another 20–40% on top.
How Your Balance Shrinks Over 30 Years
Every payment splits between interest and principal, and that split shifts dramatically over the life of the loan. Here's the balance curve for that same $320,000 loan at 6.5%:
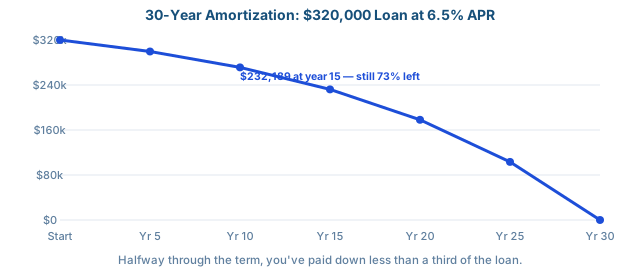
Notice that at the 15-year mark — the halfway point in time — you've paid down barely a quarter of the loan. That's the nature of amortization: interest dominates the early years.
15-Year vs. 30-Year: Which Term Is Right for You?
Using recent average rates (5.96% for a 15-year fixed and 6.58% for a 30-year fixed, per Freddie Mac's weekly Primary Mortgage Market Survey), the same $320,000 loan looks very different depending on the term:
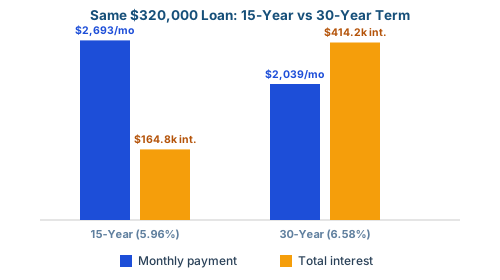
The 15-year loan costs about $650 more per month — but saves roughly $249,000 in total interest. A 30-year term makes sense if cash-flow flexibility matters most; a 15-year term makes sense if you can comfortably afford the higher payment and want to build equity faster and pay far less interest overall.
Rate source: Freddie Mac Primary Mortgage Market Survey, week ending July 23, 2026. Mortgage rates change weekly — check a current source before relying on a specific figure.
Additional Costs Included in a Mortgage
A useful mortgage calculator accounts for the recurring costs tied to homeownership, most of which lenders collect through an escrow account alongside your loan payment.
Property Tax Obligations
Property taxes fund local services and are based on your home's assessed value. The monthly estimate is:
Effective rates vary dramatically by state:
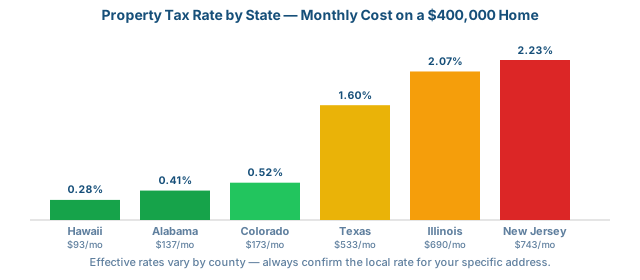
Effective property tax rates are approximate 2026 state averages compiled from multiple public sources; actual rates vary by county and are set locally.
Homeowners Insurance
Lenders require homeowners insurance for as long as you carry a mortgage. The national average premium is about $2,543 per year (~$212/month) for standard dwelling coverage, but location has an outsized effect:
| Region Type | Representative State | Avg. Annual Premium | Monthly Impact |
|---|---|---|---|
| High Risk (Hurricane) | Florida | $7,136 | $594.67 |
| High Risk (Tornado/Hail) | Oklahoma | $5,010 | $417.50 |
| National Average | - | $2,543 | $211.92 |
| Low Risk | Delaware | $1,374 | $114.50 |
| Lowest Risk | Hawaii | $659 | $54.92 |
Source: Insurance.com 2026 state-by-state homeowners insurance rate analysis, $300,000 dwelling coverage.
Ancillary and Maintenance Costs
Homeowners Association (HOA) fees, maintenance reserves, and utilities are worth budgeting for separately. A common rule of thumb is the "1% Rule" — setting aside roughly 1% of your home's value per year for maintenance. On a $400,000 home, that's about $333/month.
Total Monthly Mortgage Cost Formula
Example: $400,000 home, 20% down, 6.5% rate, 1.2% tax, $125/month insurance, $333/month other costs → $2,880.95 total monthly payment.
How to Use This Mortgage Calculator
1. Define Home Price: Enter the total purchase price.
2. Determine Down Payment: Input a percentage; below 20% typically triggers PMI.
3. Select Loan Term: 30-year (lower payment) vs 15-year (less total interest).
4. Input Interest Rate: Use a current market average, or your actual lender quote.
5. Configure Taxes and Insurance: Enter your specific local figures — the defaults are national averages only.
6. Calculate and Analyze: View your monthly payment, total loan cost, and the payment breakdown chart.
Benefits of Using a Mortgage Calculator
One practical use is checking your numbers against the 28/36 rule: housing costs at or below 28% of gross monthly income, and total debt at or below 36%.
| Gross Monthly Income | Monthly Housing Limit (28%) | Total Debt Limit (36%) |
|---|---|---|
| $5,000 | $1,400 | $1,800 |
| $8,000 | $2,240 | $2,880 |
| $12,000 | $3,360 | $4,320 |
| $15,000 | $4,200 | $5,400 |
Other benefits include comparing loan products side by side, seeing the real total interest cost (at 7% on a $300,000 loan over 30 years, interest alone exceeds $418,000), and planning debt strategically before you're in a dealership-style negotiation with a lender.
How Your Down Payment Affects PMI and Your Payment
Private Mortgage Insurance (PMI) is required whenever your down payment is below 20%, and it disappears entirely once you cross that line. Here's the monthly cost across four down payment sizes on the same $400,000 home:
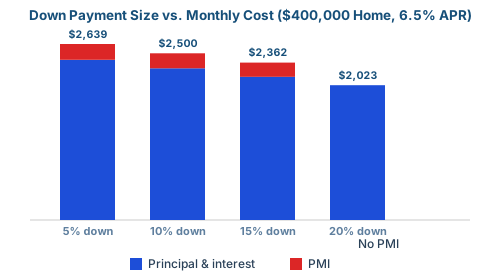
Going from 5% to 20% down doesn't just lower your loan amount — it eliminates roughly $210–240/month in PMI on top of that, since PMI is calculated as a percentage of the loan balance and disappears once you hit 20% equity.
Tips to Reduce Mortgage Payments
Pre-Purchase Optimization
Your credit score has a direct, sizable effect on the rate you're offered. As of early 2026, a FICO score of 800 was earning roughly 6.4% APR on a 30-year fixed loan, while the median rate across all credit tiers ran closer to 6.9%. The general pattern — illustrated below — holds even as the exact numbers shift with the market:
| Credit Tier | Relative Rate Impact | Illustrative Monthly P&I ($300k loan) |
|---|---|---|
| 760+ (Excellent) | Best available rate | ~$1,950–2,000 |
| 700–759 (Good) | +0.1–0.2 points | ~$1,990–2,040 |
| 660–699 (Fair) | +0.3–0.5 points | ~$2,040–2,100 |
| 620–639 (Poor) | +0.7–1.0+ points | ~$2,120–2,200 |
Illustrative ranges based on typical spreads published by myFICO's Loan Savings Calculator; exact rates change frequently and vary by lender — check myFICO or your own lender for current figures.
Eliminating PMI by reaching 20% down typically saves $210–240/month at today's rates (see the chart above). Post-purchase strategies worth exploring include refinancing when rates drop meaningfully below your current rate, requesting PMI removal once you've built 20% equity, and periodically checking whether your escrowed tax and insurance estimates still match reality.
Example Mortgage Payment Table (30-Year Fixed)
| Loan Amount | Interest Rate | Monthly P&I | Est. Taxes/Ins. | Total Monthly PITI |
|---|---|---|---|---|
| $250,000 | 6.00% | $1,499 | $450 | $1,949 |
| $300,000 | 6.50% | $1,896 | $540 | $2,436 |
| $350,000 | 6.75% | $2,270 | $630 | $2,900 |
| $400,000 | 7.00% | $2,661 | $720 | $3,381 |
| $500,000 | 6.25% | $3,079 | $900 | $3,979 |
Who Should Use a Mortgage Calculator?
- First-Time Home Buyers: Understand the full monthly cost, not just the sticker price, before you start shopping.
- Real Estate Investors: Model cash-on-cash return and rough cap rate scenarios.
- Existing Homeowners: Evaluate whether a refinance actually pays off given closing costs and the new rate.
- Financial Planners: Compare extra principal payments against other uses of that same money.
Frequently Asked Questions (FAQ)
A digital tool using the amortization formula to estimate monthly home loan costs, including principal, interest, taxes, and insurance.
The principal and interest (P&I) calculation is exact, given accurate inputs. Total accuracy depends on how closely your local tax and insurance inputs match your actual rates.
Yes. This calculator has dedicated fields for property tax rate, homeowners insurance, and other annual costs, so your results reflect a full PITI estimate, not just principal and interest.
Yes, enter your remaining balance as the home price with a 0% down payment, along with your new rate and term.
A 30-year term gives you the lowest monthly payment and more cash-flow flexibility. A 15-year term costs more per month but saves a substantial amount in total interest and builds equity faster.
This is usually due to PMI (required when your down payment is under 20%) or higher-than-average local property taxes and insurance costs.
Final Thoughts on Using a Mortgage Calculator
Navigating the mortgage market rewards quantitative planning over guesswork. A mortgage calculator that includes taxes and insurance — not just principal and interest — gives you the clearest possible picture of what a home will actually cost you every month, and lets you compare loan products, terms, and down payment sizes before you're under pressure to decide.
Small differences in credit score, down payment, or loan term compound into large differences over 30 years, as the charts above show. Whether you're a first-time buyer figuring out what you can afford or a current homeowner weighing a refinance, running your own numbers — with your own local tax and insurance figures, not national averages — is the most useful thing this tool can do for you.