AP Statistics Score History
Introduction to AP Statistics Score History
AP Statistics score history provides valuable insight into trends and distributions of exam results over the years. Analyzing these scores helps students understand the difficulty of the exam, set realistic goals, and tailor study plans for maximum effectiveness.
Historical Score Distribution
The AP Statistics exam is scored from 1 to 5, with 5 being the highest. Based on the College Board's official 2024 score distribution, the most recent full year on record breaks down as follows:
- Score 5: 17.5% of students
- Score 4: 21.8% of students
- Score 3: 22.5% of students
- Score 2: 15.9% of students
- Score 1: 22.3% of students
About 61.8% of students scored a 3 or higher in 2024. These percentages shift slightly each year based on exam difficulty and student performance.
Year-by-Year Score Trends
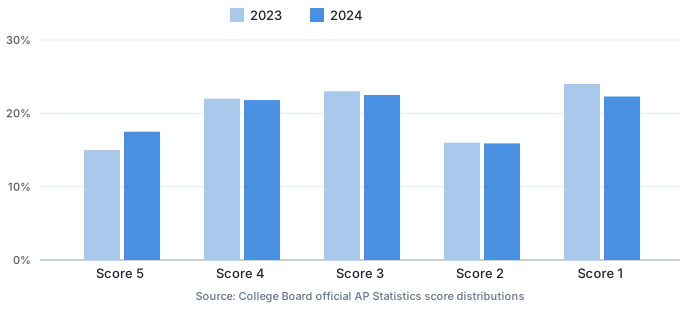
- 2024: 17.5% scored 5, 21.8% scored 4, 22.5% scored 3, 15.9% scored 2, 22.3% scored 1
- 2023: 15% scored 5, 22% scored 4, 23% scored 3, 16% scored 2, 24% scored 1
The share of students scoring a 3 or higher has drifted modestly upward, from around 60% in 2023 to roughly 62% in 2024. We've limited this comparison to years with figures we could verify against official College Board data rather than estimate further back.
Source: College Board official AP Statistics score distributions.
Score Goals and What They Mean
- Score 5: Mastered content; focus on reasoning & FRQ clarity.
- Score 4: Strong performance; review weak areas & practice FRQs.
- Score 3: Passing; emphasize core concepts and probability/inference.
- Score 2/1: Focus on basics, statistical vocabulary, and guided practice exercises.
Common Mistakes Affecting Scores
- Misinterpreting data sets and distributions
- Errors in hypothesis testing calculations
- Poor communication in FRQs
- Ignoring assumptions like independence & randomness
- Skipping Investigative Task practice
Planning Your Preparation Using Score History
- Identify high-weight topics from past exams
- Focus practice on commonly missed areas (probability, regression)
- Simulate your expected score using AP Statistics Score Calculator
- Time management practice for multiple-choice & FRQs
- Understand how Investigative Tasks affect scores
Internal Resources
Frequently Asked Questions (FAQs)
Why is AP Statistics score history important?
It helps students set realistic goals, prepare effectively, and benchmark performance.
What is the typical AP Statistics score distribution?
In recent years, roughly 17-18% of students scored a 5, 22% a 4, 22-23% a 3, 16% a 2, and 22-24% a 1, based on official College Board data.
How do MC and FRQ scores affect overall performance?
Both are weighted equally; consistent preparation is crucial.
Does the Investigative Task affect score trends?
Yes, as it carries significant points in the FRQ section.
Can practice exams predict my AP score?
Yes, combined with historical trends, they give a strong estimate.